Interval Count Report
The interval count report demonstrates looping through the list of
music_data records in a score,
while saving state to make comparisons between notes.
Only the first note of each chord, as it appears in the MusicXML file, is compared.
The report procedure counts the number of each interval in a piece, where positive numbers are upward intervals,
and negative numbers are downward intervals.
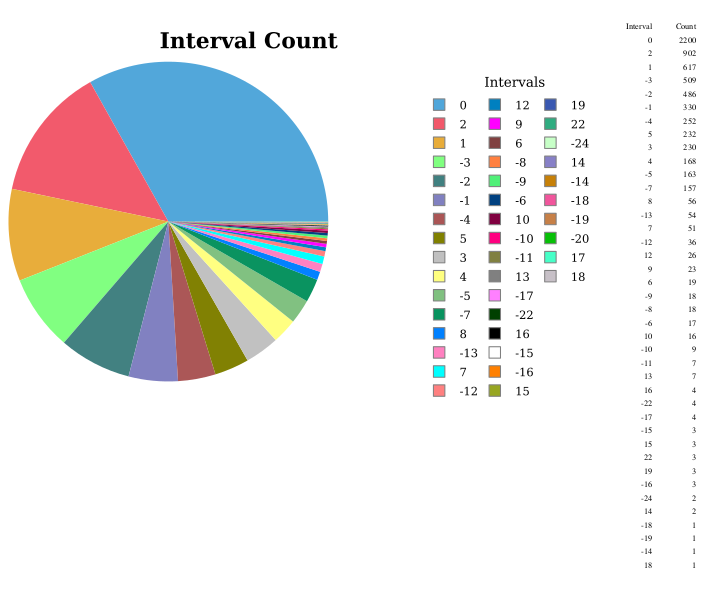
The report visualization displays each interval and its count, from the highest count to the lowest.
Reports output
Beethoven Symphony No. 4, 1st movement:
J. S. Bach Brandenburg Concerto No. 6:
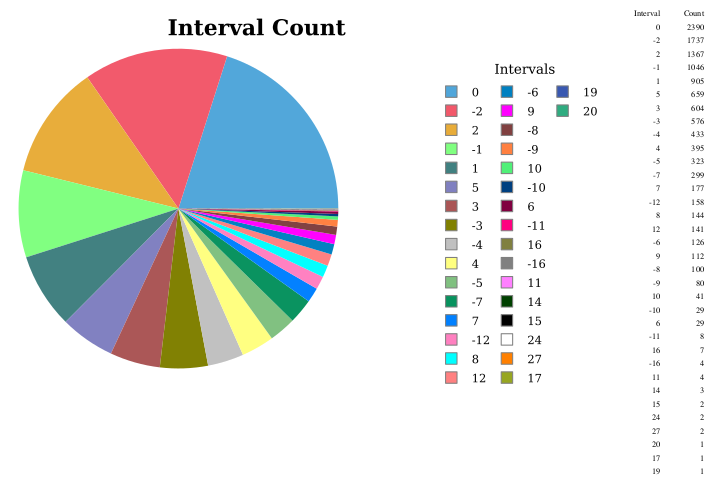
Report visualization
I've chosen a pie chart visualization for the interval count display.
To set up the report:
- Right click the project in the Navigator pane, select New -> Report, and name the report in the File Name box
To set up the data source:
- Double click the library in the Navigator pane
- Select the mysql data source in the Resource Explorer pane
- Double click the interval count report in the Navigator pane
- Right click the data source in the Resource Explorer pane and select Add to Report
The visualization report is web-based and will have a prompt to enter the score ID.
To add the score ID prompt:
- Right select Report Parameters in the Data Explorer pane, and select New Parameter
- Enter the name as
score_id, the Prompt Text asScore ID:, and the Data Type as Integer - Make sure Is Required is selected
To set up the report query:
- Right click Data Sets in the Data Explorer pane and select New Data Set
- Verify the JDBC Data Source, and name the data set in the Data Set Name box
-
Paste the Query Text from below; the query selects from the reports table populated in the stored procedure above.
The query is also included in file
reports_queries.sqlin the zipped procedures file.
I've cast the
pitch_interval column to a char type because BIRT has difficulty with negative numbers as a category name.
The sort order of the interval names in the report is in interval count order.
The query string contains a
? which is a query parameter.
- In the next window for creating the new data set, select Parameters
- Edit the listed parameter, giving the name
score_id, Data Type Integer, Linked To Report Parameterscore_id
To create the layout:
- Click the empty layout in the layout area. In the menu, select Insert -> Chart
- Select Chart Type: Pie
- Select Data: Slice Size Definition:
row["interval_count"], Category Definition:row["interval_name"], Use Data From: the Data Set you've created - Format Chart: Chart Area: set the Title
To run the report:
- Select the report in the Navigator pane
- In the menu, select Run -> View Report -> In Web Viewer
You can further refine the chart by right clicking the chart in the report area,
and setting various formatting options.