Pitch Count Report
The pitch count report demonstrates working with a simple loop through the list of
music_data records in a score.
The report procedure counts the number of occurrences of each unique pitch (pitch class) in a piece.
The report visualization displays the count for each pitch.
Reports output
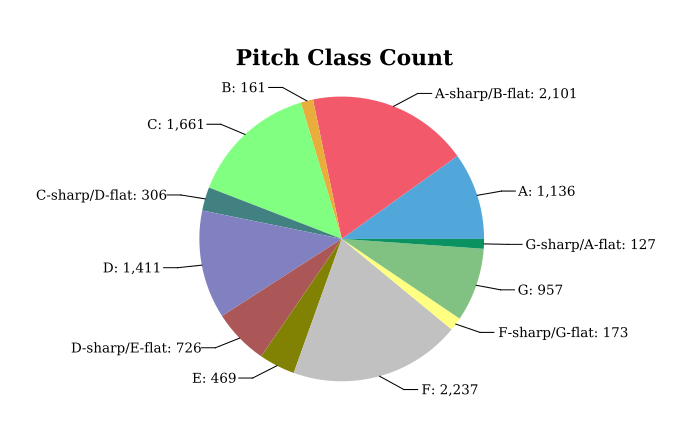
Beethoven Symphony No. 4, 1st movement:
J. S. Bach Brandenburg Concerto No. 6:
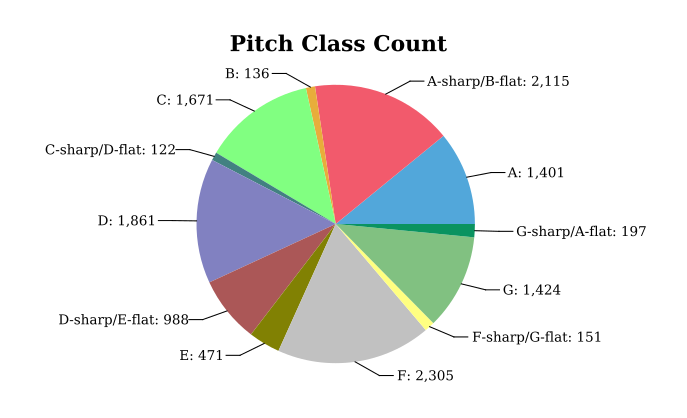
Report visualization
I've chosen a pie chart visualization for the pitch count display.
To set up the report:
- Right click the project in the Navigator pane, select New -> Report, and name the report in the File Name box
To set up the data source:
- Double click the library in the Navigator pane
- Select the mysql data source in the Resource Explorer pane
- Double click the pitch count report in the Navigator pane
- Right click the data source in the Resource Explorer pane and select Add to Report
The visualization report is web-based and will have a prompt to enter the score ID.
To add the score ID prompt:
- Right select Report Parameters in the Data Explorer pane, and select New Parameter
- Enter the name as
score_id, the Prompt Text asScore ID:, and the Data Type as Integer - Make sure Is Required is selected
To set up the report query:
- Right click Data Sets in the Data Explorer pane and select New Data Set
- Verify the JDBC Data Source, and name the data set in the Data Set Name box
-
Paste the Query Text from below; the query selects from the reports table populated in the stored procedure above.
The query is also included in file
reports_queries.sqlin the zipped procedures file.
The query string contains a
? which is a query parameter.
- In the next window for creating the new data set, select Parameters
- Edit the listed parameter, giving the name
score_id, Data Type Integer, Linked To Report Parameterscore_id
To create the layout:
- Click the empty layout in the layout area. In the menu, select Insert -> Chart
- Select Chart Type: Pie
- Select Data: Slice Size Definition:
row["pitch_count"], Category Definition:row["pitch_label"], Use Data From: the Data Set you've created - Format Chart: Chart Area: set the Title
To run the report:
- Select the report in the Navigator pane
- In the menu, select Run -> View Report -> In Web Viewer
You can further refine the chart by right clicking the chart in the report area,
and setting various formatting options.